THE SEARCH
for
DARWIN'S
equations
Charles Darwin thought of the idea of evolution and natural selection. However, he only came up with the idea, not specific formulas or equations. The problem is, in fact, more complicated than most people would think, and it has puzzled many scientists for a long time.
The Bak-Sneppen model of evolution is a very interesting solution to this problem. First published by Per Bak and Kim Sneppen [1], it compares an ecosystem to a sandpile. Each grain of sand dropped affects all of the grains near it. This causes an avalanche, which may be big or small, almost unpredictably. Evolution can be similar in that when one species changes, it can cause other species to change, which may, in turn, cause their neighbors to change, resulting in an "avalanche"!
The Bak-Sneppen model assumes that an entire species mutates at once. It uses a long list of numbers to represent the fitness of each species in the system. At each "time step", the single species with the lowest fitness mutates, or is replaced by a new species, equivalently. The two species directly adjacent in the list are also affected. These three numbers are all replaced with new, random numbers.
In the sandpile model, the pile forms a state known as self-organized criticality, or SOC. In SOC, any disturbance causes a chain reaction which will result in an avalanche. A state of SOC in the sandpile would be that state in which most sites, if not all, are only a few grains of sand away from toppling onto their neighbors, or a sandpile with steep slopes that will conduct avalanches.
In the evolution model, SOC is the level at which a mutation in one species will (in general) lower the fitness of at least one other, which will then mutate to compensate for this, and so on. This happens when the fitnesses of the species are above a "critical threshold", called l c , or lambda-c, which is about 2/3 in the original model.
Bak and his colleagues argue that the sandpile model creates mass extinctions on its own through its avalanches. However, they do not address how the model would respond to influence from outside, like meteorite impacts or climate shifts. These events do happen, and life proceeds as before, except with different species. If the model does not demonstrate this behavior, it cannot accurately represent evolution.
Will the Bak-Sneppen model really simulate life, with external catastrophes added? I will collect data from the model with external catastrophes, and see if it forms a self-organized critical state or not.
My hypothesis is that the model will function properly, even with my catastrophes. A catastrophe should affect many species and cause a lot of mutation, which this model will certainly have, and then allow things to return to normal. The model should show this behavior and return to its normal, critical state, since the catastrophe makes a disturbance quite similar to a mutation that would start an avalanche.
I have written a computer program to run the Bak-Sneppen model and simulate external catastrophes. This program is written in C and runs under Linux. It has other functions to tweak the list of fitnesses and save screenshots. The code for this program is included in the report.
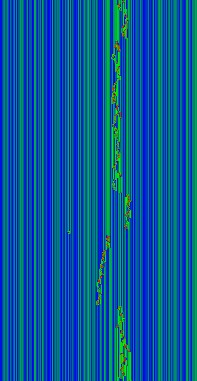
My program opens up a window. In the display, there is a large rectangular area which represents the world. When the program starts, you get a set of random species. These are represented in the rectangle by a single row, at the bottom. When the next time step takes place, the row scrolls up, and a new row appears at the bottom. Each of the species remains the same color in the next row if it has not mutated. The colors correspond to the fitness level, with red being the least fit and blue the most. You can play around with the fitnesses of some of the species by clicking inside the rectangle. You can resize the window and have larger or smaller pixels. There is a button labelled "auto cat" which runs my experiment. There is another button labelled "catastrophe", which activates the catastrophe pen. Then if you click inside the rectangle, you get a catastrophe at the place you clicked. You can alter the speed of the time steps if you need to see it more slowly.
The program will run the model as described earlier, with nothing special. It also generates "catastrophes" by these steps:
1. It generates a random "disaster time," and runs the model for that amount of time with nothing special.
2. A random species is targeted and a size (0 to 1) is chosen.
3. Each species is assigned a probability of being affected, chosen based on the product of its closeness to the target species and the size of the disaster. In other words, the closest species to the target are the most likely to be affected, and the larger the disaster is, the more species will be likely to change.
4. Species are chosen semi-randomly based on their probability and are then affected by having their fitnesses multiplied by a random factor (0 to 1).
5. The program repeats.
I ran this model and the original each for several hours, allowing for several samples of each.
The first set of graphs show the normal system. During the first 2000 time steps or so, the system is in the sub-critical "growth" stage. After this time, the system is in a "normal" state of self-organized criticality. The fluctuations are the result of the avalanches. There are small avalanches, quick movements down and up; there are larger ones, which contain many small ones and make significant movements in the graph; and there are the very large ones, almost too big to be counted, which make changes in the entire curve. Each avalanche improves the system; it does not stop until it does so.
The next graphs each show 50000 time steps of my experiment. Each of the large "spikes" on the graph corresponds to one catastrophe. After every catastrophe, the system returns to a state like that in the original model. The catastrophes are different sizes, so some catastrophes do not affect the overall system very much. The program reacts as it should, although I may have put in more catastrophes than I needed to prove the program's effectiveness. I have also included the data on when the catastrophes occurred and how big they were. This is included with each graph.
My hypothesis was correct. The Bak-Sneppen model did function properly, even with catastrophes. Catastrophes caused a lot of mutation and then allowed the ecosystem to return to normal. The model did return to SOC, and had many avalanches before the next catastrope started. The catastrophes did act something like the avalaches, but they did not improve the sytem. This was exactly as I thought it would be.